A supefood to aid in reducing global malnutrition – or a plague on local agriculture?
There is widespread opposition to genetically modified foods – and yet there are real issues of food insecurity, malnutrition, hunger and famine, particularly as climate change accelerates across the globe. Is there an ethical, ecological, and beneficial way to improve the lives of the poor in developing regions, by enhancing the nutritional quality of staple food crops, such as rice?
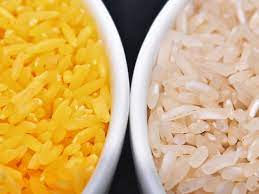
Golden Rice is a variety of rice that was genetically engineered in the 1990s via the insertion of two genes that switch on production of beta-carotene, to generate a nutritionally fortified food. Beta carotene is converted into vitamin A when metabolized by the body. Golden Rice was viewed as a potential tool to combat deficiencies in Vitamin A in developing regions across the world, particularly where local populations are highly dependent on rice. White rice provides a significant proportion of the daily caloric intake for over half the world’s population, in countries such as Bangladesh, India, Malaysia, Indonesia, Myanmar, Vietnam and the Philippines.
While virtually unknown in the western world, Vitamin A deficiencies are an ongoing global public health issue, particularly affecting children in sub-Saharan Africa and south Asia. In some regions, young children are weaned on rice gruel, made from white rice, which lacks essential nutrients. The World Health Organization estimates that 250,000 to 500,000 children who consume diets deficient in Vitamin A become blind each year, and half of these die within a year of losing sight. Vitamin A deficiencies also contribute to respiratory and intestinal infections in children, as well as slowing bone development.
Do the benefits outweigh the risks?

Back in 2000, Time magazine featured Golden Rice on their cover with the caption: “This rice could save a million kids a year.” Alas, it wasn’t so simple. As a genetically modified food, Golden Rice is “weighed down with all the political, ideological and emotional baggage that has come to be associated with GMOs – stultifying government overregulation, fear and hostility, and criticism,” reports Foreign Policy.
And yet, there are powerful supporters. The World Bank has recommended that staple crops be fortified with micronutrients to combat malnutrition across the globe. The Bill and Melinda Gates Foundation supports the development of genetically modified crops as an aid in fighting food insecurity. More than 100 Nobel laureates publicly supported the introduction of the genetically modified Golden Rice. However, challenges remain. Before Golden Rice can be introduced, government regulators in each country must analyze the data and declare it safe for human consumption. Canada and the United States approved Golden Rice in 2018, and the Philippines was the first Asian country to approve it, in 2019. Soon afterward, this approval was challenged in Philippine courts, and later re-approved, as government officials declared it a “powerful tool of science to feed the future.”
“The story of Golden Rice thus makes for a sad and maddening tale of scientists being repeatedly thwarted in their attempts to invent, improve, breed, field-test, and disseminate a potentially lifesaving food.”
Foreign Policy Magazine 2019
Golden Rice is vehemently opposed by groups such as Greenpeace and the Earth Island Institute for a variety of reasons. Primarily, they fear that its introduction will decrease agricultural biodiversity and serve as a “Trojan horse,” to open the door to more widespread industrial farming with genetically modified crops. They believe that profits are more likely to be reaped by large international corporations, so that foreign companies will dominate local markets, with small family farms more likely to falter. They also propose that the genetically modified seeds will cross-breed and spread inadvertently, cross contaminating local fields of rice crops.
And of course, regional malnutrition can not be attributed to the deficit of a single nutrient or vitamin, but rather the lack of regular access to a varied and nutritious diet. There are of course, larger socioeconomic, political, and cultural issues at play, as well as local wars and climate issues. Greenpeace claims that Golden Rice is “environmentally irresponsible, poses risks to human health and could compromise food, nutrition and financial security.” In addition, UNICEF already has an effective and inexpensive oral Vitamin A supplementation program in place, which can reportedly, improve a child’s chance of survival by 12 to 24 percent.
In fact, Golden Rice was not developed for profit. In 2004, the company Syngenta renounced commercial interest in the product. It was announced that the rice would be given free to subsistence farmers, who can save seeds to replant from year to year.
Countering other issues raised by detractors, Ingo Potrykus, professor of plant sciences at the Swiss Federal Institute of Technology, and one of the early developers of Golden Rice, has written, “Emotions are the problem, not rational discourse.” Potrykus believes that opposition groups have waged a war of propaganda against scientific research. In his paper “Golden Rice and Beyond,” he addresses the arguments raised by Greenpeace and others, noting that, “It fulfills an urgent need by complementing traditional interventions. It presents a sustainable, cost-free solution, not requiring other resources…. Industry does not benefit from it. Those who benefit are the poor and disadvantaged. It is given free of charge and restrictions to subsistence farmers.”
In their article “Allow Golden Rice to save lives, ” Wu et al argue: “Those who oppose transgenic or genetically modified organisms raised concerns that led policymakers to delay the approval of the technologies. One argument relates to biotechnology company profits. But because the Golden Rice technology to the public sector is available at no cost for humanitarian uses, this concern is irrelevant.” They conclude, “The tragedy of Golden Rice is that regulatory delays of approval have immense costs in terms of preventable deaths, with no apparent benefit.”
Even so, controversy continues, with proponents avidly advocating for each side. More research is needed to settle the environmental, economic and dietary consequences of widespread use of such modified crops. Production of Golden Rice will remain limited across the globe for the foreseeable future.
—
References:
“The true story of the genetically modified superfood that almost saved millions,” Foreign Policy, October 2019
“The Golden Rice Project” News updates on the Golden Rice project
“Golden Rice and Beyond,” Ingo Potrykus, Plant Physiology March 2001
“Genetically Modified Organisms: The Golden Rice Debate,” NYU Langone Health
“The Golden Rice Tale” by Ingo Potrykus, AgBioWorld
“Improving the nutritional value of Golden Rice through increased pro-vitamin A content.” Nature Biotechnology April 2005.
“Why we Oppose Golden Rice” Earth Island Journal October 9, 2020
“In a grain of golden rice, a world of controversy over GMO foods.” NPR March 2013
“Allow Golden Rice to Save Lives,” F. Wu, J. Wesseler et al. PNAS December 2021